Loading…
Apa yang Dicari Pembeli
These figures come from qualified search, RFQ and managed sourcing activity on the platform. Bot traffic, internal sessions and duplicate spam are excluded.
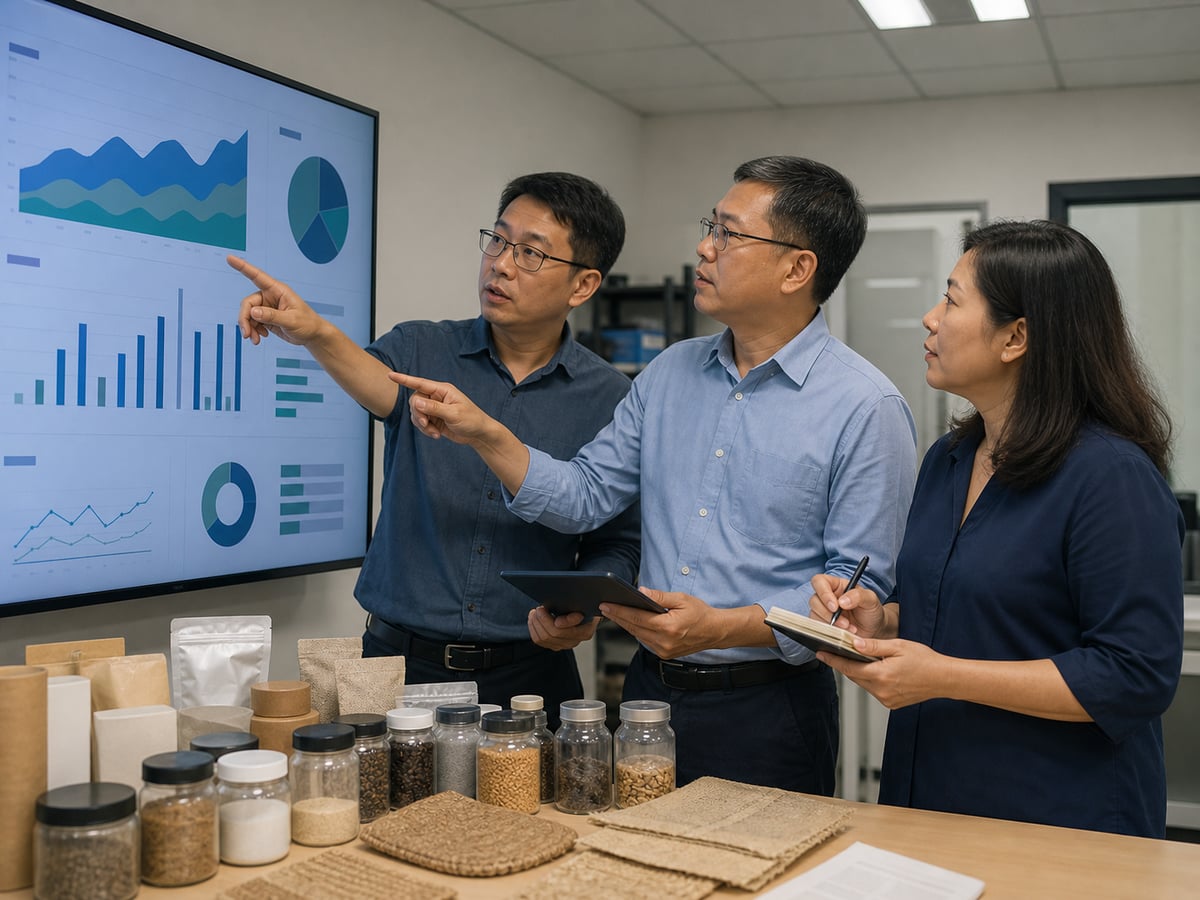
Data demonstrasi sampel — angka ini hanya pemegang tempat sehingga digantikan oleh aktiviti platform sebenar.
Highest demand
| export | 134 |
|---|---|
| oem | 113 |
| logistics | 111 |
| insurance | 110 |
| interior design | 93 |
| it automation | 92 |
| machinery | 91 |
| solar systems | 90 |
| construction | 89 |
| building materials | 87 |
Rising demand
| solar systems | +25% |
|---|---|
| machinery | +24.7% |
| insurance | +20.9% |
| logistics | +20.7% |
| oem | +18.9% |
| export | +16.5% |
Where suppliers are limited
| machinery | 7.00 |
|---|---|
| packaging | 6.36 |
| building materials | 5.80 |
| logistics | 5.29 |
| solar systems | 4.74 |
| insurance | 4.07 |
| export | 4.06 |
| food products | 4.06 |
| interior design | 4.04 |
| oem | 3.65 |
A category is only shown once it reaches a minimum level of genuine activity. Percentages are withheld where the sample is too small to be meaningful — a trend built on a handful of searches would be misleading rather than useful.